Provide traditional methods of production data analysis (Arps,
Fetkovich, Blasingame, Agarwal-Gardner, NPI, and Transient analysis methods).
Provide traditional methods of production data analysis (Arps,
Fetkovich, Blasingame, Agarwal-Gardner, NPI, and Transient analysis methods).
The key parameters such as formation permeability, average
formation pressure and others are obtained by using the combined graph analysis method (the
differential pressure double-log analysis under the unit flow and the flow double-log
analysis method under the unit pressure difference).
The actual time, the material balance time and the cumulative
amount time are respectively provided as the horizontal axis; the actual pressure
difference, the flow rate, the pressure difference under the unit flow and the flow rate
under the unit pressure difference are provided as the vertical axis; the straight line
segment analysis method of the various coordinate combinations figures is provided
(right-angle, linear flow, bilinear flow, Semi-log, etc.).
Considering the influence of gas adsorption, stress sensitivity
and gas slip-off effect on the dense gas, the shale gas and the coal-bed gas, the
multi-section fracturing model of the horizontal well is provided.
The concept of equivalent virtual time is put forward, and the
historical simulation problem of pressure, flowrate and accumulated flowrate under the
change of working system (oil nozzle and gas nozzle) and shut-in in production are realized.
The data analysis methods of oil-water two-phase and oil-gas
two-phase and gas-water two-phase production are proposed, and the prediction of the
production capacity and the accumulation amount of the multi-phase fluid are put forward.
Provide gas-liquid two-phase flow regime calculation: For
gas-liquid two-phase fluid, pressure conversion methods (single-phase liquid, single-phase
gas, gas-liquid uniform flow, Hagedorn-Brown, Harsan-Kabir, Begges-Brill, Dons-Ros,
Orkiszewski, Aziz, Mukherjee-Brill) considering various wellhead-to-bottom hole conditions
are provided. And at the same time, calculation modules such as a pressure change under
different depths and so on are provided.
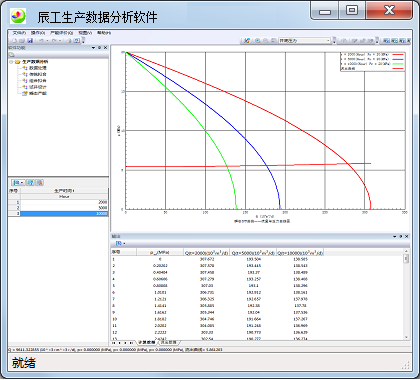
Provide powerful productivity prediction function (transient
productivity, flow change at fixed bottom hole pressure, analysis of oil and gas reservoir
parameters influences to productivity, etc.).
Provide visual display function: According to the parameters of
production data analysis or well testing analysis, calculate the formation pressure
distribution at different times under the variable output and display the animation in
three-dimensional graph.


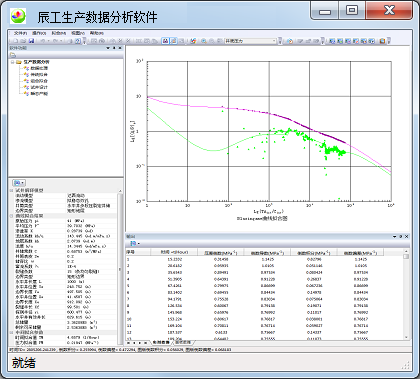 图1
Blasingame拟合图
图1
Blasingame拟合图 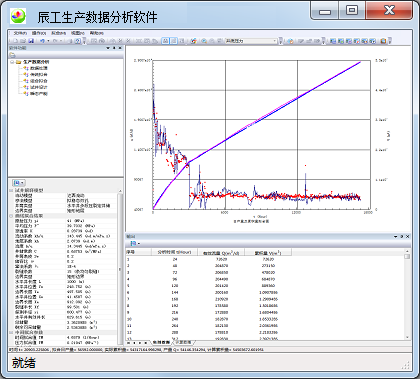 图2
流量及累积量拟合图
图2
流量及累积量拟合图