产品展厅>>产品销售>>辰工试井系列软件>>早期试井分析

试井分析中的半对数解释方法是基于不稳定渗流的径向流理论,而压力及导数双对数拟合试井分析是基于计算典型曲线图版,这两种方法都需要生产及关井时间达到径向流,对于低渗透油气藏在有效的测试时间内,很难满足这个要求。软件采用早期小信号提取及放大的试井分析方法,节约了关井测试时间,可以提高资料解释率和压力资料解释精度,从而降低成本、增加产量。早期试井分析已在现场得到应用验证。

对低渗透油气田,由于采用早期小信号提取及放大技术,解决了不出现径向流的压力资料解释问题。

通过图版拟合可解释地层渗透率及表皮等,减少试井分析的多解性。

在早期数据采样点较密且数据不凌乱的情况下,可缩短关井时间。

可以与导数曲线联合进行分析,提高资料解释的精度。
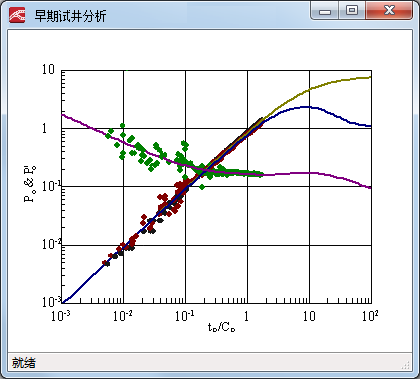
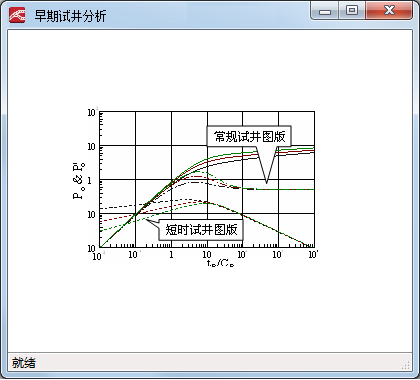
图1 早期试井图 图2 某井例早期拟合图 图3 某井例早期拟合图

Products>>Products on Sale>>Chengong Well Testing Software Series>>Early Well Testing Analysis

The semi-logarithmic interpretation method in well testing analysis is based on the radial flow theory of unstable seepage, while the pressure and derivative double logarithmic simulation well testing analysis is based on the calculation of typical curve chart. Both methods require the production and shut-in time to reach the radial flow. It is difficult to meet this requirement for the low permeability oil and gas reservoir within the effective testing time. The software uses the early small signal extraction and amplification well testing analysis method, which saves the shut-in test time, improves the data interpretation rate and the pressure data interpretation accuracy, thus reduces the cost and increases the output. Early well testing analysis has been applied and verified in field.

For low permeability oil and gas fields, the problem of pressure data interpretation without radial flow is solved by using early small signal extraction and amplification technology.

The formation permeability, skin and so on can be explained by chart simulation, and the multiple solutions of well testing analysis can be reduced.

Under the condition that the early data sampling points are dense and the data is not messy, the well shut-in time can be shortened.

It can be analyzed with derivative curve to improve the accuracy of data interpretation.

Figure1: Early well testing chart Figure2: Early simulation chart of a well Figure3: Early simulation chart of a well